
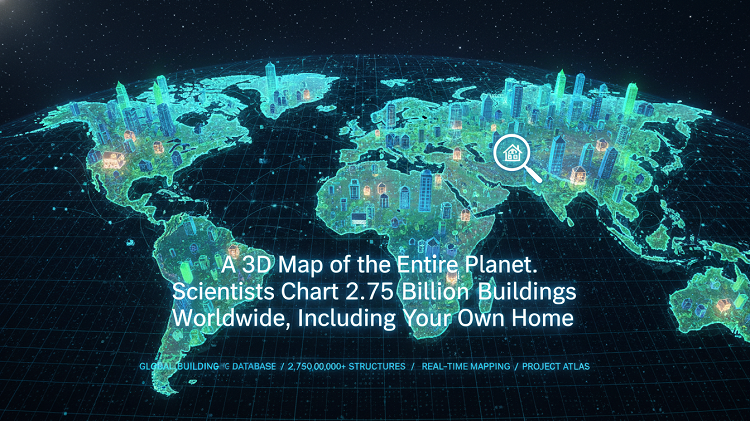
From centuries-old stone cottages in Edinburgh to glass-clad skyscrapers soaring above Shanghai, a groundbreaking new digital map now allows users to explore nearly every building on Earth all rendered in three dimensions.
Researchers have unveiled what is being described as the most comprehensive global building dataset ever created, charting an astonishing 2.75 billion individual structures across the planet. The project, known as the GlobalBuildingAtlas, represents a dramatic leap forward in both scale and detail, containing more than a billion additional buildings compared with the previous largest global database.
The map is freely accessible online through an interactive interface, allowing anyone to zoom in on cities, towns, and even individual neighborhoods. With just a simple address search, users can locate their own homes or virtually tour distant locations thousands of miles away, all from a satellite-based perspective.
Built From Space With the Help of AI
The GlobalBuildingAtlas was developed by a team of scientists at the Technical University of Munich (TUM) in Germany, who relied on an unprecedented volume of satellite imagery combined with advanced artificial intelligence.
To build the dataset, the researchers analyzed nearly 800,000 satellite images captured in 2019, drawing on optical and laser-scanning data from multiple Earth-observing missions. While some satellites can directly measure building heights using laser pulses, such coverage is incomplete and uneven across the globe.
To overcome this limitation, the team trained an AI system to estimate the height and volume of buildings where direct measurements were missing. The algorithm inferred these values by analyzing surrounding structures, local density, and known urban patterns essentially allowing the system to “fill in the blanks” with remarkable accuracy.
Professor Xiaoxiang Zhu, the project’s lead author, explained that the inclusion of height and volume data fundamentally changes how researchers understand the built environment.
“Traditional two-dimensional maps only show where buildings are,” Zhu said. “Three-dimensional information tells us how people actually live how much space exists, how dense cities really are, and how development differs from place to place.”
Why 3D Matters More Than You Think
Unlike conventional maps that display flat building footprints, the GlobalBuildingAtlas captures the full volume of structures, offering insights that go far beyond geography. According to the research team, this added dimension provides a more accurate picture of urbanization, inequality, and living conditions than population counts or economic indicators alone.
In dense metropolitan areas, the dataset achieves exceptional precision. The researchers say that in major cities, the resolution of their 3D models is up to 30 times finer than that of comparable global databases. In London, for example, the satellite imagery is detailed enough to distinguish bridges, riverside infrastructure, and even boats moored along the Thames.
The map also preserves historical detail. From the layered walls of the Tower of London to the precise layout of animal enclosures at Edinburgh Zoo, the data captures both modern and ancient structures with striking clarity.
An Unexpected Public Sensation
Although the project was initially intended as a scientific research tool, it quickly gained public attention after its launch. Within days, the GlobalBuildingAtlas website recorded more than 280,000 visits, far exceeding the team’s expectations.
That surge in interest occasionally strains the platform’s servers, leading to slower load times. Still, researchers say they are pleased and somewhat surprised by the public’s enthusiasm.
Many users have been drawn in by the novelty of seeing familiar places from a new perspective, while others have used the map to explore remote regions they may never visit in person.
A Longstanding Mapping Challenge
Creating a detailed global map of buildings has long been considered one of the most difficult challenges in Earth observation. Traditional methods rely heavily on airborne laser scanning or LiDAR, technologies that are expensive and impractical to deploy uniformly across every country.
As a result, previous global datasets were often incomplete, inconsistent, or limited to urban centers in wealthier nations.
The Munich team’s hybrid approach blending satellite laser data with machine learning represents a major breakthrough. It enables near-global coverage without requiring continuous laser scans of the entire planet.
“This is the first time we’ve been able to estimate building volume consistently across almost every region of the world,” Zhu said.
What the Numbers Reveal About the World
Beyond its visual appeal, the dataset offers powerful insights into how humanity has built and continues to build its environment.
According to the researchers’ analysis:
-
Asia contains the largest share of the world’s buildings, with approximately 1.22 billion structures, accounting for nearly half of the global total.
-
Africa follows with around 540 million buildings, surpassing Europe despite having fewer high-rise urban centers.
-
Europe contains roughly 403 million buildings.
-
North America and South America account for about 295 million and 264 million buildings, respectively.
-
Oceania, by contrast, has just 14 million buildings, reflecting its smaller population and vast uninhabited areas.
Using this data, the team introduced a novel metric: building volume per capita. The idea is simple the more built space available per person, the higher a country’s overall material living standard is likely to be.
In Europe, Finland leads the rankings with nearly 4,000 cubic meters of building volume per person, followed by Estonia, Sweden, and Denmark. Finland’s position aligns with its frequent ranking as one of the happiest and most prosperous nations globally.
Practical Uses Beyond Curiosity
While many users are enjoying the map simply for exploration, the GlobalBuildingAtlas has serious real-world applications.
Urban planners can use the data to design more efficient cities, identify overcrowded areas, and plan infrastructure projects. Disaster-response agencies can assess which regions are most vulnerable to earthquakes, floods, or storms based on building density and height.
The dataset can also aid climate researchers studying urban heat islands, as well as policymakers seeking better tools to measure development in regions where economic data is scarce or unreliable.
By zooming out, users can visualize building density across entire continents. Bright red clusters highlight megacities and dense urban corridors, while darker regions reveal sparsely populated rural landscapes.
A New Lens on Human Civilization
In many ways, the GlobalBuildingAtlas offers more than just a map it provides a new way to view human civilization itself. Every structure represents a story: homes, schools, hospitals, factories, temples, and offices that together form the physical footprint of humanity.
As cities continue to grow and climate pressures increase, tools like this may become essential for understanding how and where people live.