
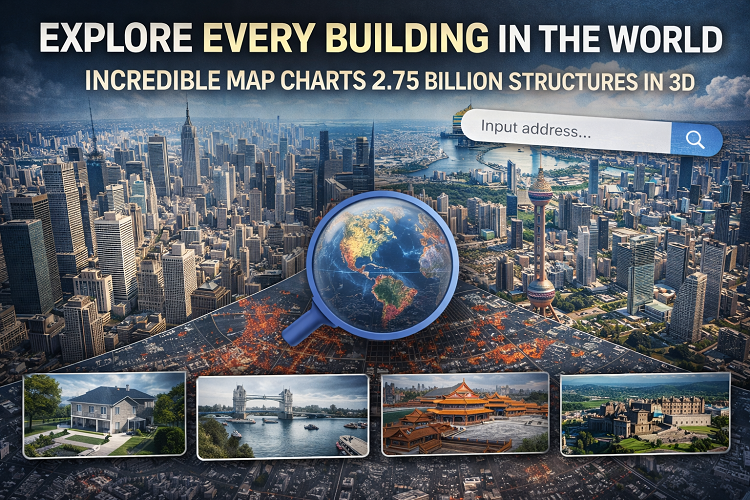
From centuries-old stone houses lining the streets of Edinburgh to the glittering glass skyscrapers that dominate Shanghai’s skyline, every building on Earth can now be explored digitally in unprecedented detail. A groundbreaking new global map has made it possible to view the location, height, and volume of nearly every man-made structure on the planet right down to individual homes.
The project, known as the GlobalBuildingAtlas, is the most comprehensive database of buildings ever created. It charts an astonishing 2.75 billion structures in three-dimensional detail, surpassing the previous largest dataset by more than one billion buildings. Researchers say the map marks a major leap forward in how scientists understand urban growth, population distribution, and global inequality.
Developed by a team of scientists at the Technical University of Munich (TUM) in Germany, the GlobalBuildingAtlas uses advanced satellite imagery combined with artificial intelligence to generate a detailed, planet-wide picture of the built environment.
A World Mapped from Space
The atlas was created using nearly 800,000 satellite images captured in 2019, drawing on optical and laser-scanning data collected from orbit. Traditionally, creating accurate 3D building maps required specialized satellites equipped with laser-based LiDAR systems, which are expensive and limited in coverage. As a result, high-quality 3D maps were previously confined to select cities or wealthy regions.
To overcome this limitation, the TUM researchers employed machine learning techniques capable of estimating building heights even in areas where direct laser data was unavailable. By analyzing the shapes, shadows, and surrounding structures, the AI system inferred the vertical dimensions of buildings based on patterns observed in neighboring areas.
Professor Xiaoxiang Zhu, the project’s lead author, explained that this approach dramatically expands what researchers can see and measure.
“Three-dimensional building information provides a far more accurate picture of urbanization and poverty than traditional two-dimensional maps,” Zhu said. “Instead of just seeing building footprints, we can measure volume, which gives us deeper insight into living conditions and economic development.”
An Interactive Tool Anyone Can Use
One of the most remarkable aspects of the GlobalBuildingAtlas is that it is publicly accessible. Users can type an address or location into an interactive search bar and instantly generate a 3D model of almost any place on Earth.
In dense urban environments, the resolution of the data is exceptionally high up to 30 times more detailed than many existing global building datasets. In cities like London, the map captures not only individual buildings but also infrastructure such as bridges and even boats on the River Thames. In Beijing, historic sites like the Forbidden City are clearly visible, while in New York, towering skyscrapers are rendered with striking accuracy.
Even remote areas are included. The satellite data is sensitive enough to detect small settlements, such as isolated towns deep within Australia’s Northern Territory, demonstrating that the map is not limited to major population centers.
Since its launch, the website hosting the map has drawn hundreds of thousands of visitors, far exceeding expectations. Researchers noted that the platform was designed primarily for academic and policy research, not mass public use, and its unexpected popularity has occasionally caused slow loading times.
Beyond Curiosity Why the Map Matters
While the atlas is undeniably fascinating for casual exploration, its true value lies in its scientific and practical applications. Detailed knowledge of the world’s buildings is critical for understanding economic inequality, planning infrastructure, preparing for disasters, and managing population growth.
Until now, global estimates of housing and urban density relied heavily on incomplete data or coarse approximations. The GlobalBuildingAtlas provides a consistent, worldwide framework that allows researchers to compare regions on equal terms.
One of the most innovative outcomes of the project is a new metric known as building volume per capita. This measure calculates how much built space exists for each person in a given country or region. The assumption is simple: greater space per person generally correlates with higher living standards and economic stability.
Using this metric, the researchers found stark disparities across the globe.
Global Patterns in the Built Environment
According to the dataset, Asia is home to approximately 1.22 billion buildings, accounting for nearly half of all structures worldwide. Africa follows with around 540 million buildings, surpassing Europe, which has roughly 403 million. North America and South America have 295 million and 264 million buildings, respectively, while Oceania contains just 14 million.
When building volume per capita is considered, the differences become even more striking. Finland leads Europe with more than 3,900 cubic meters of building volume per person, placing it well ahead of many other countries. Researchers noted that Finland frequently ranks among the happiest nations in the world, a fact that may align with its high availability of personal and public space.
By contrast, countries that have faced prolonged economic challenges show significantly lower building volume per capita. Greece, for example, has roughly six times less built space per person than Finland. In many African nations, the gap is even wider, with building volume per capita hundreds of times lower than in wealthier countries.
Applications for Planning and Disaster Response
The potential uses of the GlobalBuildingAtlas extend far beyond academic analysis. Urban planners can use the data to identify regions that lack sufficient housing or public infrastructure. Governments and international organizations may rely on the atlas to guide investment in schools, hospitals, and transportation networks.
Disaster prevention and response is another key application. By identifying where buildings are densely clustered, authorities can better assess vulnerability to earthquakes, floods, wildfires, and other natural hazards. The German Aerospace Center is already exploring how the atlas can support emergency response efforts worldwide by providing rapid assessments of affected areas.
The atlas also allows researchers to simulate future scenarios, such as population growth or urban expansion, helping policymakers make informed decisions before crises emerge.
A New Way of Seeing the World
By zooming out, users can view heat-map-style visualizations showing where building density is highest. Bright red regions reveal major cities and urban corridors, while darker areas highlight sparsely populated landscapes. This global perspective offers a powerful visual reminder of how unevenly human development is distributed across the planet.
The researchers behind the project hope that the GlobalBuildingAtlas will continue to evolve as newer satellite data becomes available. Future updates could improve resolution even further and allow for near-real-time monitoring of urban growth.
Ultimately, the atlas represents a shift in how humanity understands its footprint on Earth. By mapping nearly every structure ever built, scientists have created not just a tool for exploration, but a foundation for smarter, fairer, and more resilient planning in the years ahead.